
ggENOx / enhanced combustion technology for end-port furnaces
ggENOx is a patent filed system using various type of media such as compressed air, fuel or oxygen. A small amount of media, injected into the furnace, supports the internal flue gas recirculation to reduce peak temperatures and concentrations. The proven concept is easy to apply and operate and can be installed at any End-Port furnace.
- NOx reduction of 55 to 60 % and values below 500 mg/Nm³ have been reached
- fuel reduction of 2 to 3 % or pull increase of 2.5 to 8 %
- quality increase
- no negative effect on glass quality, pull, temperature profile, CO concentration etc.
- more homogenous combustion
- low investment and operating costs
Flue Gas Analysis / various positive effects
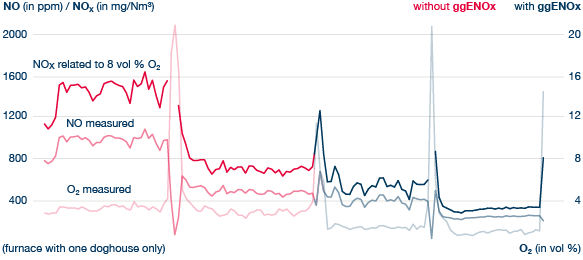
The following graphic shows a flue gas analysis sample for two left and right firing periods when installing ggENOx.
ggENOx significantly reduces the NOx emissions but also reduces the variation of the NOx measuring data, an indicator for a more stable combustion.
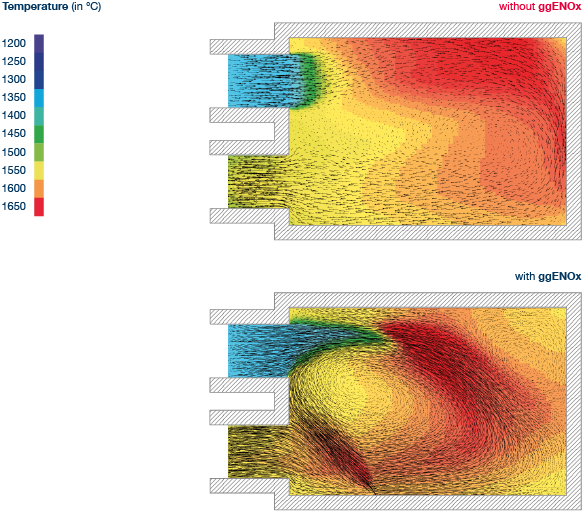
The additional effects are a reduction of the O2 concentration in the flue gas by 0.2 to 0.5 %, an increase of the flue gas temperatures, a possible reduction of the hotspot temperatures, 4 to 10 % increase of the effective heat transfer in the melting zone and a significant retraction of the batch line.
Emissions / NOx reduction
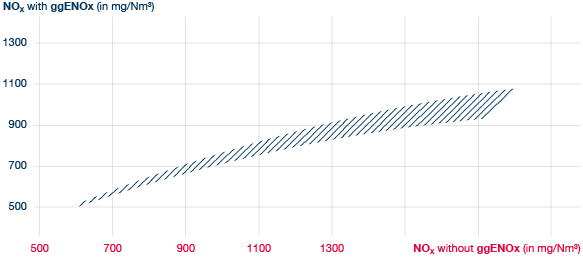
As being said, ggENOx significantly reduces the NOx emissions. The NOx reduction depends on the base values, production and glass specifics. E.g. form 1200 mg/Nm³ related to 8 vol % of oxygen we typically reach 800 to 850 mg/Nm³.
The next graphic shows what NOx values related to 8 vol % of oxygen will be reached depending on the base values.
Production / reduction of the Spec. Energy Consumption & more
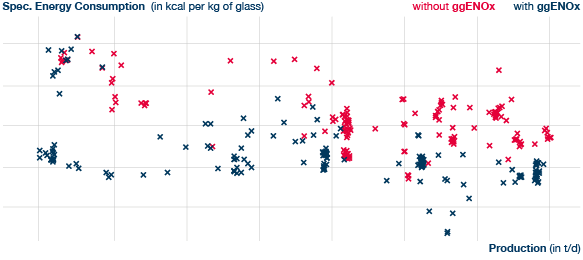
According to the mentioned effects and in addition to the NOx reduction, ggENOx can help to reduce energy costs and/or to enhance glass quality and/or to increase production.
The following graphic shows an installation sample and indicates an energy consumption reduction on average of approx. 3 %.
Payback / low investment and operating costs
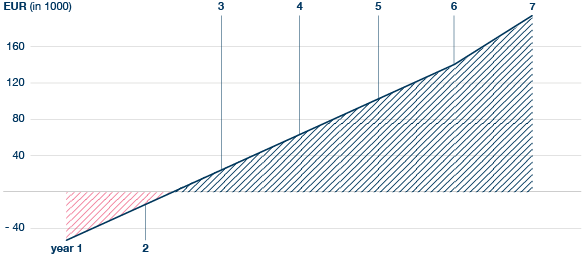
The following graphic illustrates a typical payback time of approx. 2.5 years taking an energy cost reduction of 3 % into account. This payback time while increasing the production is much better, typically 0.5 years.
Even when a »deNOx« system, and »SCR« in particular, is already installed, ggENOx significantly reduces the »deNOx« operating costs whereas the payback time can reach 3 years as well.